 Core Revision

Revision aid, not clinical advice. This page is educational material written for exam preparation. It is not a substitute for the current guideline or for clinical judgement, and must not be relied on for the care of any individual. Always check up-to-date national guidance and verify independently before acting on anything here.
 AKT Statistics Guide · Part 1 · Chapter 1
Averages: Mean, Median & Mode
Three numbers all called “the average” — which one to trust, and the one that quietly misleads.
Where this shows up in the AKT
- Evidence and data interpretation is around 10% of the paper.
- A favourite format: here is a summary statistic — is it the right one for these data?
- Reading and criticising skewed clinical data, where the mean and median diverge.
The word “average” hides three different numbers. Choosing the wrong one is one of the easiest marks to drop on the paper — and one of the easiest to bank once you have seen the trick.
Three ways to say “average”
Same word, three very different numbers. Get the definitions clean and the rest follows.
Mean — add and divide
- Mean = add every value up, then divide by how many there are.
- It uses every value, which is its strength — and, when there are outliers, its weakness.
Median — the middle value
- Median = line the values up in order and take the middle one.
- It cares only about position, so a single extreme value barely moves it — it is robust.
Mode — the most common
- Mode = simply the most frequent value.
- The only average that works for categorical data, such as the commonest presenting complaint.
Worked example — one outlier, two stories
Here are eight patients’ waiting times, in minutes: 3, 4, 4, 5, 6, 7, 9, 40. Seven of the eight waited under ten minutes; one waited forty. So what number best describes the typical wait?
| Summary | Value (mins) | What it tells you |
|---|---|---|
| Median | 5.5 | A fair reflection of the typical wait |
| Mean | 9.75 | Dragged up by the single 40-min outlier |
- The median is the average of the two middle values (5 and 6): (5 + 6) ÷ 2 = 5.5 — close to what most patients actually experienced.
- The mean is 78 ÷ 8 = 9.75 — higher than the wait of seven of the eight patients, because that one forty-minute wait pulls it upward.
One outlier; two very different headlines. With eight values, the median sits between the 4th and 5th values once they are in order.
What skew does to the average
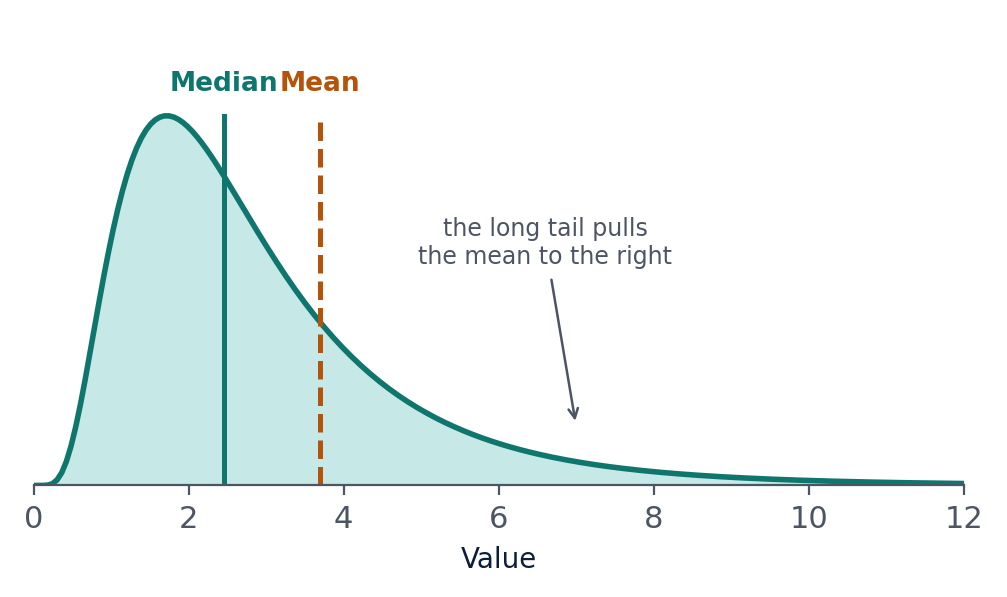
The gap between the mean and the median is a fingerprint of skew — an asymmetric distribution with a tail to one side.
How the tail moves the mean
- Symmetrical data: the mean and median sit close together.
- Right skew (a tail of high values): the mean is pulled above the median.
- Left skew (a tail of low values): the mean is pulled below the median.
So which one do you report?
- Symmetrical data → the mean, because it uses every value.
- Skewed data or outliers → the median, reported with the interquartile range (IQR).
- Categorical data → the mode.
In medicine, expect skew
A great deal of clinical data has a long right tail: length of stay, waiting times, time-to-event, CRP, ferritin, income and units of alcohol. For these, the median with the IQR tells the honest story; mean ± SD overstates the typical patient.
The traps that cost marks
Most patients on a ward stay 2–4 days, but a few stay many weeks, so the data are heavily right-skewed. What is the best single summary of the typical length of stay?
- The mean
- The median
- The mode
- The range
- The standard deviation
Reveal answer
B — the median. The handful of very long stays inflate the mean above the typical patient, whereas the median reflects the middle of the distribution and resists those outliers. Skewed data: reach for the median (and report it with the IQR). The mode would only give the single commonest stay, and the range and standard deviation describe spread, not the typical value.
Lock it in
- Mean: add and divide — best for symmetrical data, but sensitive to outliers.
- Median: the middle value — your go-to for skewed data and outliers, reported with the IQR.
- Mode: the most common value — for categories.
- Giveaway: if the mean and median are far apart, the data are skewed (mean above median → right skew).
Want more questions like this one?
Try the free 20-question AKT taster: sixteen clinical, two evidence-based practice and two admin questions, with the reasoning after each and a marked report. No card needed. The full AKT Pack has 2,000+ more.
← Back to the AKT Statistics Guide
by Core Revision · corerevision.com