 Core Revision

Revision aid, not clinical advice. This page is educational material written for exam preparation. It is not a substitute for the current guideline or for clinical judgement, and must not be relied on for the care of any individual. Always check up-to-date national guidance and verify independently before acting on anything here.
 AKT Statistics Guide · Part 5 · Chapter 16
Forest Plots & Meta-Analysis
How a single picture pools dozens of studies — reading the diamond, the line of no effect, and the heterogeneity behind it.
Where this shows up in the AKT
- Interpreting a forest plot — deciding whether a pooled result is significant from where the diamond sits.
- Reading heterogeneity (I²) and saying what a high value means for the pooled estimate.
- Spotting publication bias on a funnel plot, and resisting the trap that every study must individually show benefit.
A meta-analysis sits at the top of the evidence hierarchy: it statistically combines the results of several studies into one pooled estimate. The forest plot is how that estimate is drawn.
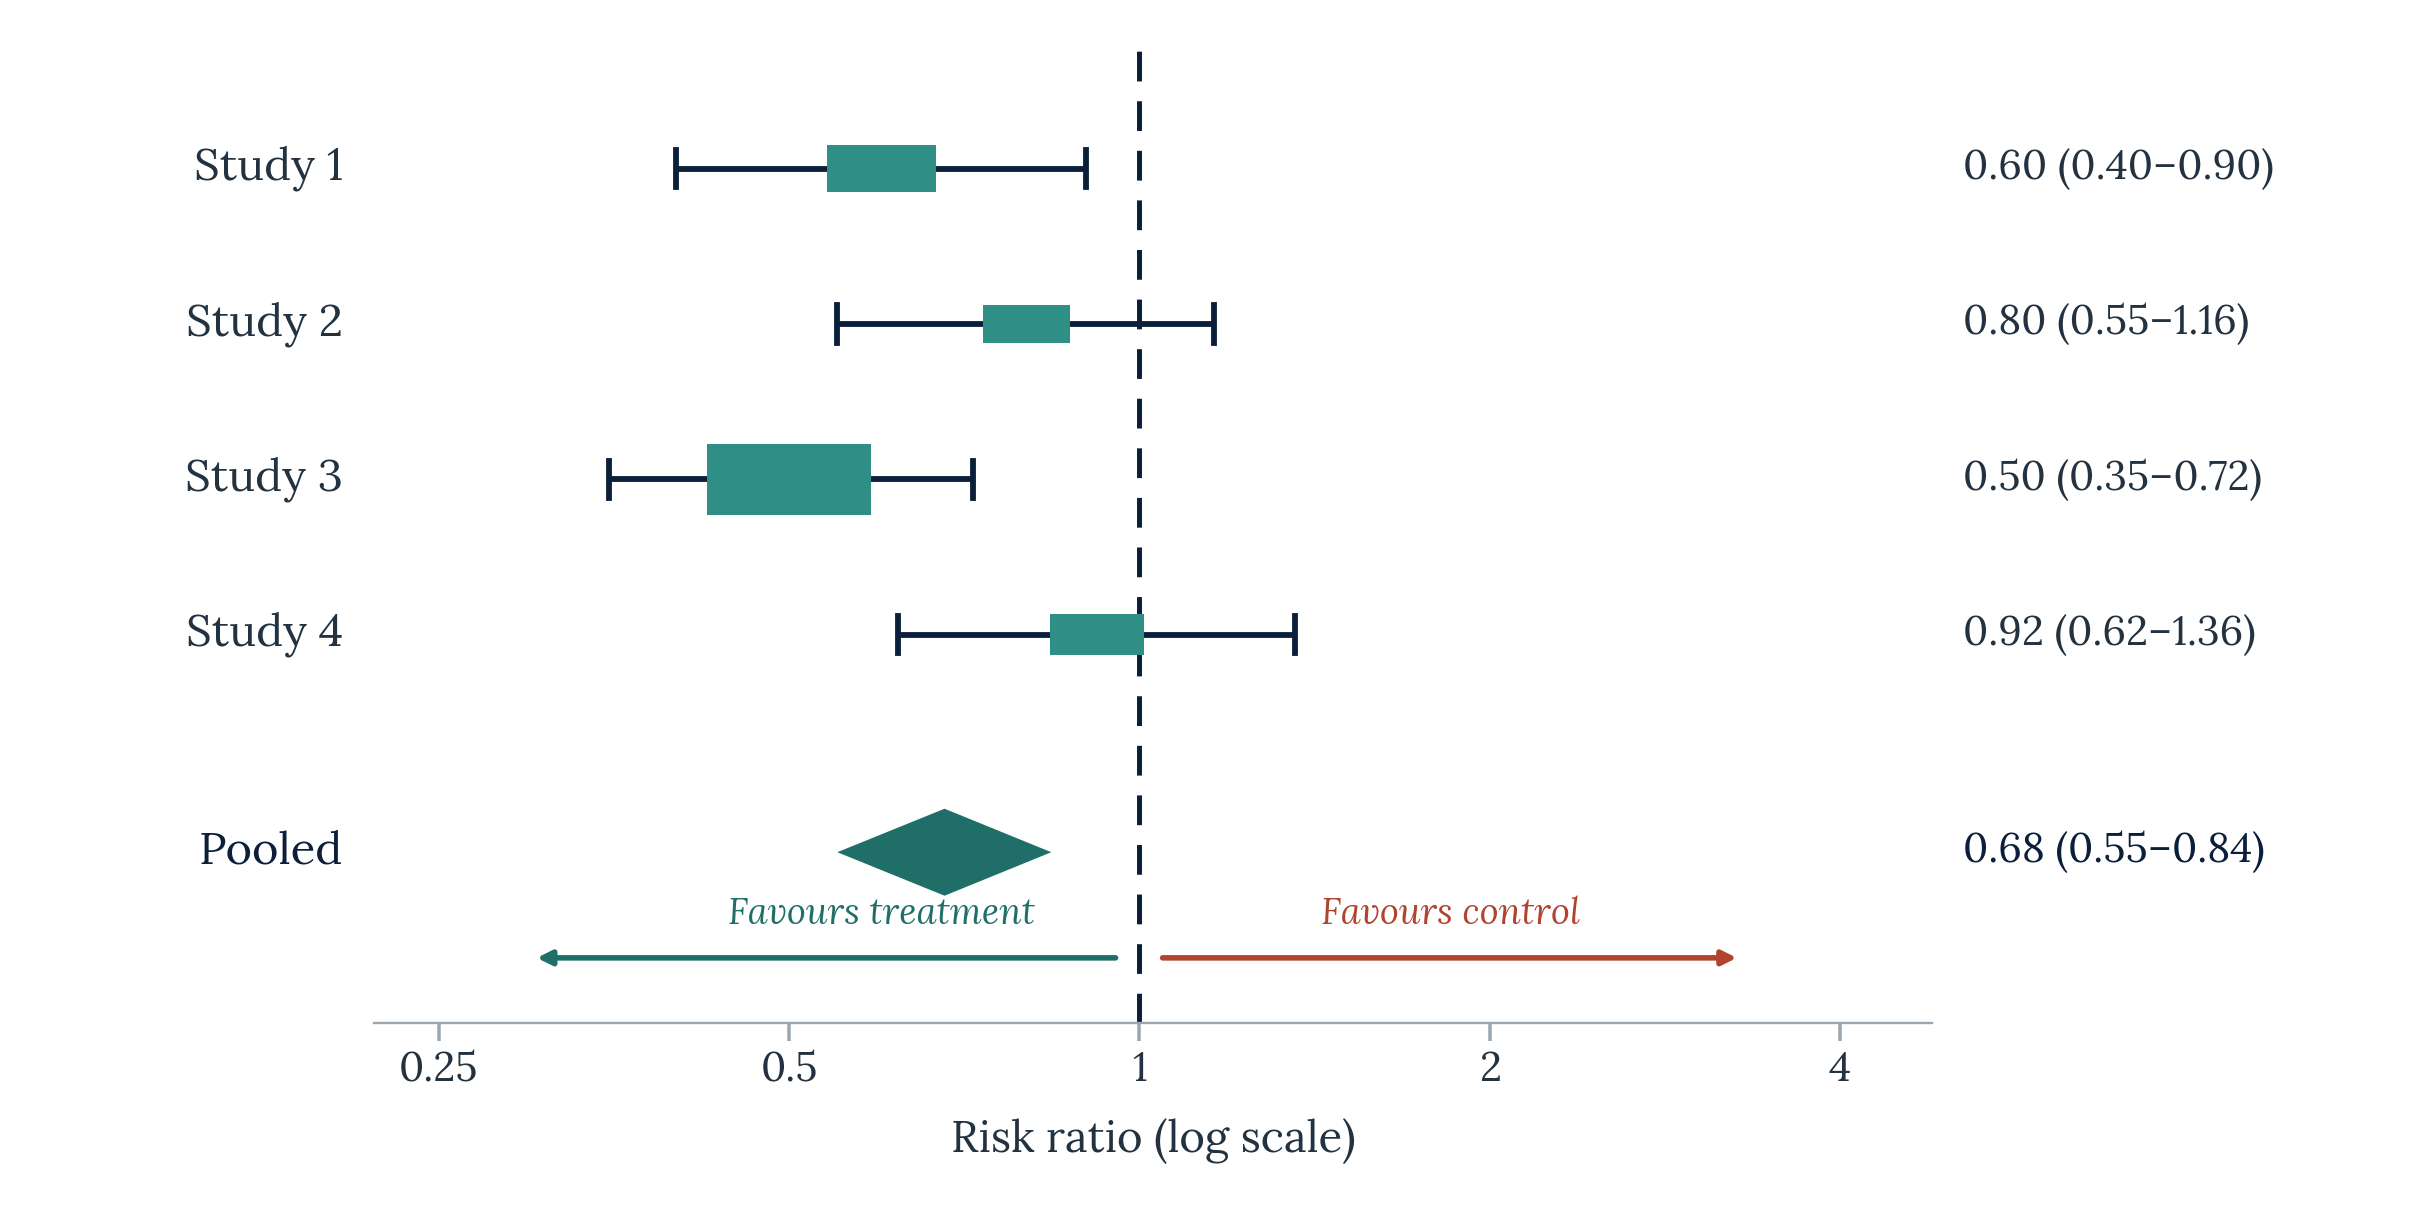
Anatomy of a forest plot
Read it row by row, then drop to the diamond. Every element on the plot is telling you one specific thing.
| Element | What it means |
|---|---|
| Each horizontal line | One study — its 95% CI (the line) and its point estimate (the box) |
| Box size | That study’s weight in the analysis — bigger box = more weight |
| The diamond | The pooled effect across all studies (its width is the pooled CI) |
| Vertical line | The line of no effect — at 1 for ratios, at 0 for differences |
- The line of no effect is 1 for ratios (RR, OR, HR) and 0 for differences (mean difference). Mixing those up is a classic slip.
- If the diamond crosses the line of no effect, the pooled result is not significant. If it sits entirely to one side, it is significant.
Heterogeneity (I²) — the fruit-salad test
I² measures how much the individual studies disagree with one another — whether you are pooling apples with apples, or apples with oranges.
| I² | Interpretation |
|---|---|
| <25% | Low — “apples with apples”, safe to pool |
| 25–75% | Moderate — interpret with caution |
| >75% | High — “fruit salad”, pooling is unreliable |
- A high I² means the studies are too different to combine meaningfully. You can still report the pooled estimate, but the AKT expects you to flag it as unreliable.
- Fixed-effect vs random-effects in one line: a fixed-effect model assumes every study estimates the same true effect; a random-effects model allows the true effect to vary between studies and is the safer choice when heterogeneity is present.
Publication bias and the funnel plot
- Publication bias: positive (statistically significant) studies are more likely to be published than negative ones, which can inflate a pooled estimate.
- The funnel plot is the visual check. A symmetrical funnel suggests no publication bias; an asymmetrical one — typically a missing bottom corner — suggests the negative studies were never published.
Worked example
A meta-analysis asks whether a new antihypertensive reduces stroke risk. The pooled effect (the diamond) is a relative risk of 0.85, 95% CI 0.78–0.92, lying entirely to the left of the line of no effect.
| Pooled measure | Value | 95% CI | Crosses 1? |
|---|---|---|---|
| Relative risk | 0.85 | 0.78–0.92 | No |
- The diamond sits entirely to the left of 1 and the CI does not cross 1 → the treatment significantly reduces stroke risk.
- RR 0.85 means a 15% relative reduction in stroke. Individual studies in the plot may scatter either side of 1 — the pooled estimate is what the question is testing.
The traps that cost marks
A meta-analysis of an antiplatelet drug for recurrent stroke reports a pooled odds ratio of 0.94 with a 95% CI of 0.84–1.05, so the diamond crosses the line of no effect. Two of the eight individual studies showed a significant benefit. Which interpretation is correct?
- The pooled result shows no statistically significant effect
- The drug significantly reduces recurrent stroke
- The analysis is invalid because two studies were positive
- The line of no effect should be at 0 for this outcome
- A bigger box would have changed the pooled result
Reveal answer
A — no statistically significant effect. The diamond crosses the line of no effect (1 for a ratio) and the pooled CI includes 1, so the overall result is not significant — even though two individual studies were positive. Individual studies routinely scatter either side of the line; the pooled estimate is what counts. The line of no effect is correctly at 1 for an odds ratio (it would be 0 only for a difference), and box size reflects weight, not effect.
Lock it in
- Each line = one study (CI + box); box size = weight; the diamond = pooled effect.
- Line of no effect: 1 for ratios, 0 for differences. Diamond crossing it → not significant.
- I²: <25% low, 25–75% moderate, >75% high (“fruit salad” — pool unreliable). Random-effects when heterogeneity is present.
- Not every study must show benefit; an asymmetrical funnel plot suggests publication bias.
Want more questions like this one?
Try the free 20-question AKT taster: sixteen clinical, two evidence-based practice and two admin questions, with the reasoning after each and a marked report. No card needed. The full AKT Pack has 2,000+ more.
← Back to the AKT Statistics Guide
by Core Revision · corerevision.com